Editor’s note: This story was produced by Bay Nature — a nonprofit, independent media organization that connects the people of the San Francisco Bay Area to the natural world.
For those who like to swim, fish, or boat in San Francisco Bay, but not when it is suffused with thick, soupy, potentially hazardous algae — the California Water Boards now has a map for that.
Just in time, since algae season’s heating up. A recent glance at the map showed a rainbow spreading across the Bay, indicating a widespread bloom. In Berkeley and in Richardson Bay, near Sausalito, water sampling has confirmed it and determined the culprit is Heterosigma akashiwo—the same phytoplankton, dubbed the “flying potato” by researchers, that caused last summer’s first-ever Bay-wide harmful algal bloom, or HAB, leaving countless dead fish in its wake.
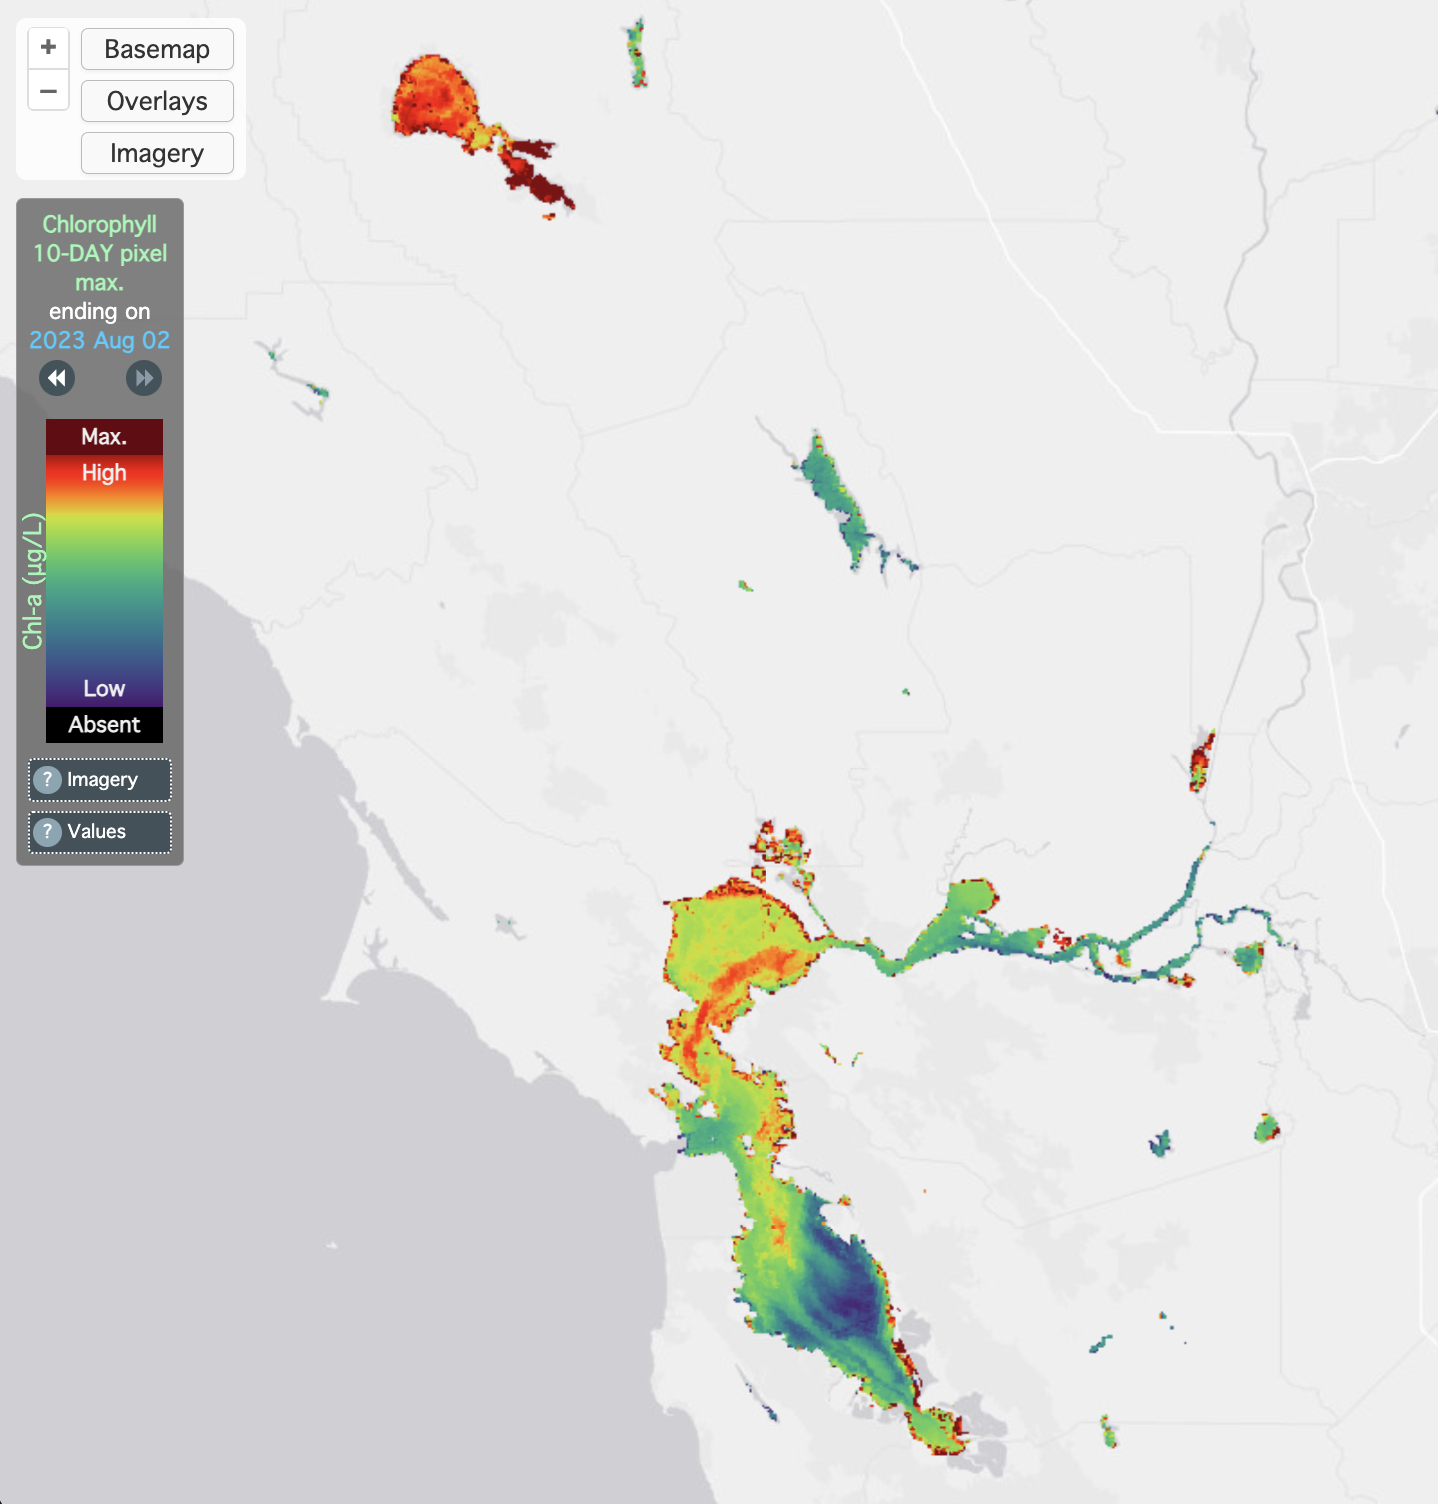
The new map is really an improvement on an existing map that showed only freshwater and estuarine blooms. Those are best indicated by cyanobacteria, as detected by a satellite that sees its telltale blue-green colors. But most marine harmful algal blooms aren’t caused by cyanobacteria. They are usually caused by other species of phytoplankton. So the improved map includes data for chlorophyll-a, a molecule the phytoplankton produce that is a different color of green. (The data comes from the satellite Sentinel-3, via the U.S. National Oceanic and Atmospheric Administration, and the map is a joint project of the Water Boards, NOAA, and the San Francisco Estuary Institute’s Aquatic Science Center.)
This map is a screening tool built for the public—and also to give a heads up to California state water and public health agencies. “This tool is really good in helping know where we should be looking and targeting for sampling,” says Carly Nilson, an environmental scientist who manages the Water Boards’ freshwater and estuarine HABs program.


Officials have not had such a heads up previously in part because—despite the enormous risk that these blooms pose to wildlife and potentially people—there is a Bay-size gap in jurisdiction. As the Water Boards reported this year to the Legislature, no agency is specifically responsible for responding to harmful algal bloom incidents in saltwater. No one agency is responsible for monitoring the Bay for the phytoplankton that causes such blooms. And no one agency is responsible for putting up warning signs. The Water Boards has recommended that the Legislature pass some legislation giving them, or another agency, such a mandate.

The jurisdiction gap helps explain why last year’s Bay-wide harmful algal bloom caught officials off guard. For freshwater blooms, agencies know what their roles and responsibilities are in responding. “Everyone knows how it’s supposed to work,” Nilson says. “For responding to marine HABs, it’s a little less formal, a little more cushy. We’re still navigating what that looks like.” Ever since the big bloom last summer, a multi-agency workgroup has been meeting to share the responsibilities.
As for the new map, officials are themselves still learning what it can tell them, according to Nilson. Just in recent days, the chlorophyll-a lit up Clear Lake (north of Santa Rosa, and known as a HAB troublemaker)—even before the cyanobacteria data “saw” it. Expect updates as they learn, and submit feedback to cyanoHAB.reports@waterboards.ca.gov. “It’s a work in progress,” Nilson says.
Tips on using satellite data to avoid HABs
Here’s a link to the HABs map.
• Use the cyanobacteria data to look for freshwater HABs, and the chlorophyll-a data to look for marine HABs, like in the Bay. (The cyano data also only looks at the largest 250 lakes in California.)
• Satellite data is a screening tool, not absolute truth. Truth comes from water sampling. There can be false positives (especially in freshwater, like when aquatic weeds are the same green as algae).
• Timescales. You can look at either the past day for the most recent data, or a 10-day average for a more “holistic” view, Nilson says, though cloud cover can sometimes interfere with data.
• How much algae is OK to swim in? That’s an open question, Nilson says. For saltwater, “the threat to human health isn’t as well understood as with some of these freshwater toxins.” But the general guidance is to try and avoid exposure to HABs of all kinds, marine or fresh, and to bathe thoroughly if you are exposed. You can learn more at the state’s Healthy Water Habits page.
• Out in the real world, don’t rely on signage to tell you when the Bay isn’t safe for recreation, because no government agency is responsible for continuously monitoring throughout a bloom or notifying the public for saltwater HABs. So, learn how to recognize harmful algal blooms visually. (And know that at the tail end of a harmful algal bloom, when the algae are dying out, they generally release a bunch of toxins. Give it a few days to settle out before you jump in.)
• Learn more: California’s Harmful Algal Blooms Portal is a central resources for all things HAB. You can review the current incident map along with the satellite data map. If you see a bloom, you can report it. And here’s a FAQ on harmful algal blooms.